Goal
When working with the Power Platform Center of Excellence (COE) toolkit, it's easy to end up with a lot of environment data — but not always a clear way to visualize it. I wanted a simple, dynamic way to turn that data into diagrams directly inside a model-driven app.
In this post, I’ll walk through how I used Power Automate, a custom Dataverse table, and Mermaid.js to automatically generate and display environment diagrams. The result is a clean, interactive view of my Power Platform environments which updates as the data changes — and it only takes a few steps to set up.
🧱 Step 1: Create a New Solution/Table to Represent Diagrams
Because I do not want to lose all of this work when the next COE updates come out, all of the work will be done in a newly created solution/table within the same environment as the COE install. See the diagram below to see how the table is shaped.
erDiagram
    DIAGRAM ||--|| ENVIRONMENT : references

    DIAGRAM {
        string DiagramName
        string ActualDiagram
    }

    ENVIRONMENT {
        string EnvironmentName
    }
- Fields:
- Diagram Name (Primary Name)
- Actual Diagram (Rich Multiline Text)
- Lookup to COE Environment table (
environmentid)
- Considerations:
- One record per diagram
- Storing rendered or raw Mermaid diagram syntax
⚙️ Step 2: Create Power Automate Logic to Build the Diagram
- The Flow will run once a day to pick up any new environments or update any existing ones.

- Create seven variables. Each one is a string type

- HTML Header
<!DOCTYPE html> <html lang="en"> <body> <pre class="mermaid"> - HTML Footer
</pre>
    <script type="module">
      import mermaid from 'https://cdn.jsdelivr.net/npm/mermaid@10/dist/mermaid.esm.min.mjs';
    </script>
  </body>
</html>
- HTML Header
- List rows from the COE Environments table that are active

- Create a scope for the single environment

- Add an Apply to each, for the List rows - COE Environments action

- Add a condition to check if a security group has been added to the environment
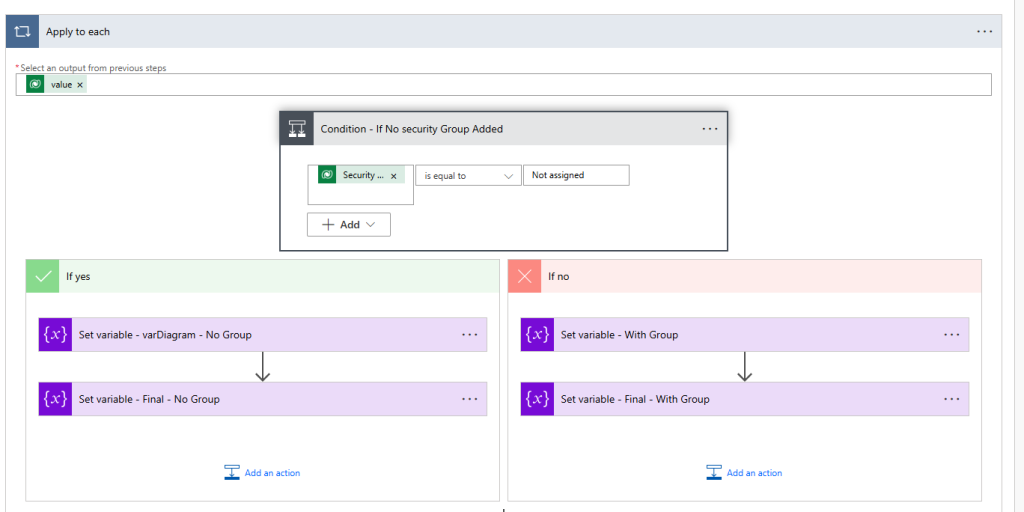
- If it is blank, set the variables as follows

- If it is not blank, set them as follows

flowchart TD
  subgraph s1["@{variables('varTennant')}"]
    n2["@{items('Apply_to_each')?['admin_securitygroupname']}"]
    n3["@{items('Apply_to_each')?['admin_displayname']}"]
  end
  n2 -- Access Control for --> n3
  ICON:n2:{ "icon": "fluent-mdl2:security-group", "pos": "b" }
  ICON:n3:{ "icon": "arcticons:microsoft-dynamics-365-remote-assist", "form": "rounded", "pos": "b" }
    style s1 fill:#FFFFFF,stroke:#D50000
    style n2 fill:transparent
    style n3 fill:#FFFFFF,stroke:none
💡 This mermaid diagram is not “correct” because we need to escape the @{} within the mermaid so it will not be assumed it is an expression
- Then, after the condition, list all current diagrams and filter it based upon the current environment

andy_diagramname eq '@{replace(items('Apply_to_each')?['admin_displayname'], '''', '''''') } - Diagram' - Another scope is added after the list rows to add the new diagram.
- Then check if the diagram is blank using the expression following expression

- Use the following to get the diagram id.
outputs('List_rows_-_Diagrams')?['body/value']?[0]?['andy_diagramid'] - If it is blank, add a new row

- If the diagram is not blank, we need to check if it has been updated.
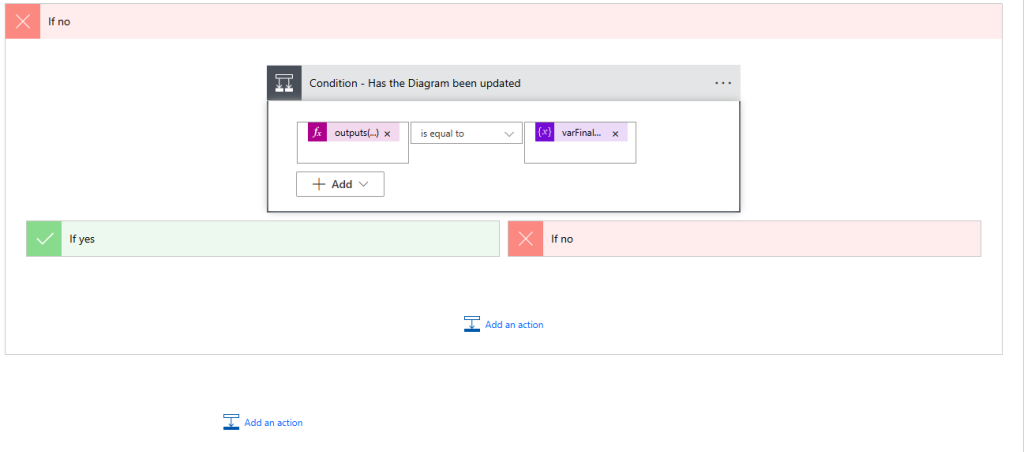
outputs('List_rows_-_Diagrams')?['body/value']?[0]?['andy_actualdiagram'] - If it has not been updated, skip else update the diagram

outputs('List_rows_-_Diagrams')?['body/value']?[0]?['andy_diagramid']
🔧 Step 3: Create the Web Resource to Render Mermaid
To display our dynamically generated diagrams, we’ll build a custom HTML + JavaScript web resource that renders Mermaid diagrams inside a Model-Driven App form. This allows you to visualize data directly from Dataverse using Mermaid.js and even include icons via Iconify packs.
🛠️ Web Resource Overview
- Type: HTML web resource (client-side)
- JavaScript: ES Module syntax (using
type="module") - Libraries:
- Mermaid.js v11
- Icon packs via Iconify JSON CDN
- Purpose:
- Fetch the diagram text from Dataverse
- Support Mermaid's new
@{ icon: ... }annotation format - Gracefully fallback if no diagram is available
🧱 How It Works (Key Parts)
🔹 1. HTML Shell + Container
html
CopyEdit
<body>
  <div id="diagramContainer">
    <pre id="diagramPre" class="mermaid"></pre>
  </div>
</body>
This is where the diagram is rendered. We use a <pre> tag with the mermaid class — Mermaid will detect and transform it into SVG.
🔹 2. Import Mermaid & Register Icon Packs
js
CopyEdit
import mermaid from "https://cdn.jsdelivr.net/npm/mermaid@11/dist/mermaid.esm.min.mjs";

mermaid.registerIconPacks([
  {
    name: "logos",
    loader: () => fetch("https://unpkg.com/@iconify-json/logos@1/icons.json").then(res => res.json()),
  },
  {
    name: "fluent-mdl2",
    loader: () => fetch("https://unpkg.com/@iconify-json/fluent-mdl2@1/icons.json").then(res => res.json()),
  }
]);

mermaid.initialize({ startOnLoad: false });
- We load Mermaid v11 as a module.
- Register any icon packs you want to use in your diagrams (
logos,fluent-mdl2, etc.) - Disable automatic rendering (
startOnLoad: false) so we can manually trigger rendering after processing placeholders.
🔹 3. Fetch Diagram Content from Dataverse
js
CopyEdit
function fetchAndDisplayDiagram() {
  const formContext = window.parent.Xrm.Page;
  const recordId = formContext.data.entity.getId().replace('{', '').replace('}', '');

  const req = new XMLHttpRequest();
  req.open("GET", `${formContext.context.getClientUrl()}/api/data/v9.0/andy_diagrams(${recordId})?$select=andy_actualdiagram`, true);
  req.setRequestHeader("Accept", "application/json");
  req.setRequestHeader("Content-Type", "application/json; charset=utf-8");

  req.onreadystatechange = function () {
    if (this.readyState === 4 && this.status === 200) {
      const result = JSON.parse(this.response);
      displayMermaidDiagram(result["andy_actualdiagram"]);
    }
  };

  req.send();
}
This pulls the Mermaid diagram from the andy_actualdiagram field on the record and passes it to our render function.
🔹 4. Replace Icon Placeholders with Valid Syntax
Because @{ ... } breaks Power Automate expressions, we use a safe placeholder in the flow like:
plaintext
CopyEdit
ICON:n2:{ "icon": "fluent-mdl2:security-group", "pos": "b" }
Then in the web resource:
js
CopyEdit
mermaidCode = mermaidCode.replace(/ICON:(S+):({[^}]+})/g, 'n$1@$2n');
This transforms placeholders into valid Mermaid syntax like:
mermaid
CopyEdit
n2@{ "icon": "fluent-mdl2:security-group", "pos": "b" }
🔹 5. Render the Diagram
js
CopyEdit
pre.textContent = mermaidCode;

mermaid.run().then(() => {
  const svg = document.querySelector("#diagramContainer svg");
  if (svg) {
    svg.removeAttribute("height");
    svg.removeAttribute("width");
    svg.style.width = "100%";
    svg.style.height = "100%";
  }
});
This tells Mermaid to render the diagram and ensures the resulting SVG expands responsively.
🔹 6. Handle Fallbacks Gracefully
If no diagram is found, or the content only contains a <title> message:
js
CopyEdit
const titleMatch = /<title>(.*?)</title>/i.exec(htmlContent);
const fallbackMessage = titleMatch ? titleMatch[1] : "No diagram available.";

document.getElementById("diagramContainer").innerHTML =
  `<div style="font-size: 1.2rem; color: #555;">${fallbackMessage}</div>`;
Full code block
<!DOCTYPE html>
<html lang="en">
<head>
  <meta charset="UTF-8" />
  <title>Diagram Viewer</title>
  <style>
    html, body {
      margin: 0;
      padding: 0;
      height: 100%;
      width: 100%;
      overflow: hidden;
    }

    body {
      font-family: Arial, sans-serif;
      display: flex;
      justify-content: center;
      align-items: center;
      background-color: #f8f9fa;
    }

    #diagramContainer {
      width: 100%;
      height: 100%;
      display: flex;
      justify-content: center;
      align-items: center;
      overflow: auto;
    }

    pre.mermaid {
      margin: 0;
      width: 100%;
      height: 100%;
      display: block;
    }
  </style>
</head>
<body>
  <div id="diagramContainer">
    <pre id="diagramPre" class="mermaid"></pre>
  </div>

  <script type="module">
    import mermaid from "https://cdn.jsdelivr.net/npm/mermaid@11/dist/mermaid.esm.min.mjs";

    // Register icon packs
    mermaid.registerIconPacks([
      {
        name: "logos",
        loader: () =>
          fetch("https://unpkg.com/@iconify-json/logos@1/icons.json").then((res) => res.json()),
      },
      {
        name: "arcticons",
        loader: () =>
          fetch("https://unpkg.com/@iconify-json/arcticons@1/icons.json").then((res) => res.json()),
      },
      {
        name: "fluent-mdl2",
        loader: () =>
          fetch("https://unpkg.com/@iconify-json/fluent-mdl2@1/icons.json").then((res) => res.json()),
      },
    ]);

    mermaid.initialize({ startOnLoad: false });

    function fetchAndDisplayDiagram() {
      var formContext = window.parent.Xrm.Page;
      var recordId = formContext.data.entity.getId().replace('{', '').replace('}', '');

      var entitySetName = "andy_diagrams";
      var columnName = "andy_actualdiagram";

      var req = new XMLHttpRequest();
      req.open(
        "GET",
        formContext.context.getClientUrl() +
          "/api/data/v9.0/" +
          entitySetName +
          "(" +
          recordId +
          ")?$select=" +
          columnName,
        true
      );
      req.setRequestHeader("OData-MaxVersion", "4.0");
      req.setRequestHeader("OData-Version", "4.0");
      req.setRequestHeader("Accept", "application/json");
      req.setRequestHeader("Content-Type", "application/json; charset=utf-8");

      req.onreadystatechange = function () {
        if (this.readyState === 4) {
          req.onreadystatechange = null;
          if (this.status === 200) {
            var result = JSON.parse(this.response);
            var diagramHtml = result[columnName];
            displayMermaidDiagram(diagramHtml);
          } else {
            console.error("Error fetching diagram:", this.responseText);
          }
        }
      };
      req.send();
    }

    function extractMermaidCode(html) {
      const match = /<pre class=['"]mermaid['"]>([\s\S]*?)<\/pre>/.exec(html);
      return match ? match[1].trim() : null;
    }

    function displayMermaidDiagram(htmlContent) {
      const pre = document.getElementById("diagramPre");
      let mermaidCode = extractMermaidCode(htmlContent);

      if (mermaidCode) {
        // Replace safe placeholders with real Mermaid icon syntax
        mermaidCode = mermaidCode.replace(/ICON:(\S+):({[^}]+})/g, '\n$1@$2\n');

        pre.textContent = mermaidCode;

        mermaid.run().then(() => {
          const svg = document.querySelector("#diagramContainer svg");
          if (svg) {
            svg.removeAttribute("height");
            svg.removeAttribute("width");
            svg.style.width = "100%";
            svg.style.height = "100%";
            svg.style.maxWidth = "100%";
            svg.style.maxHeight = "100%";
          }
        }).catch((err) => console.error("Mermaid render error:", err));
      } else {
        const titleMatch = /<title>(.*?)<\/title>/i.exec(htmlContent);
        const fallbackMessage = titleMatch ? titleMatch[1] : "No diagram available.";
        document.getElementById("diagramContainer").innerHTML =
          `<div style="font-size: 1.2rem; color: #555;">${fallbackMessage}</div>`;
      }
    }

    fetchAndDisplayDiagram();
  </script>
</body>
</html>
🧩 Step 4: Add the Web Resource to the Table Form
- Open the form editor for your custom diagram table
- Add a new iframe control:
- Link to the HTML web resource
- Set height (e.g., 8 rows)
- Optional: hide label and set border to off for a cleaner view
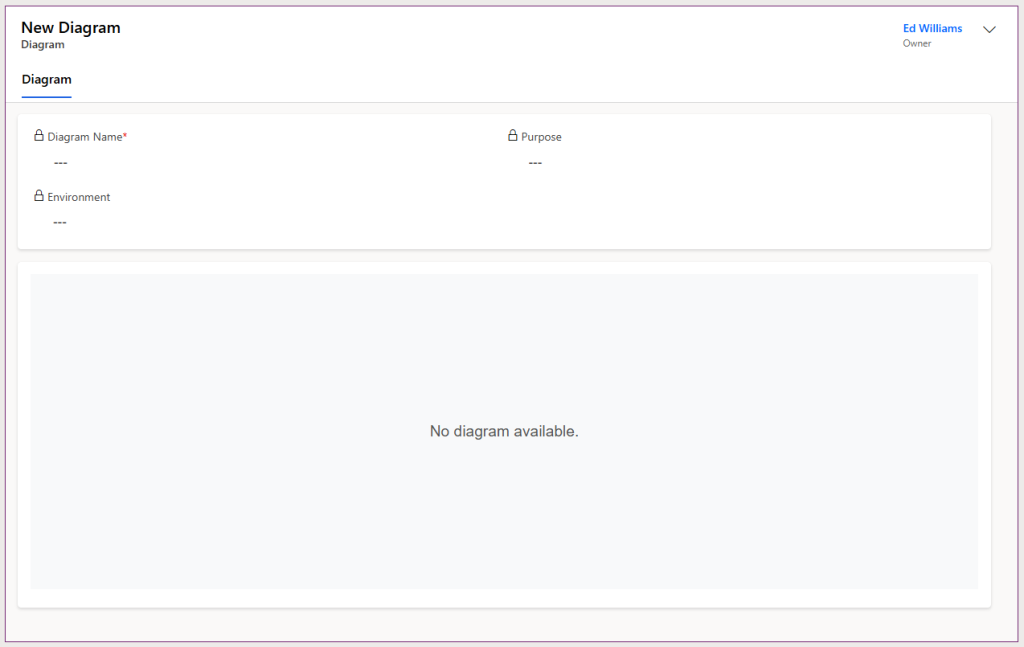
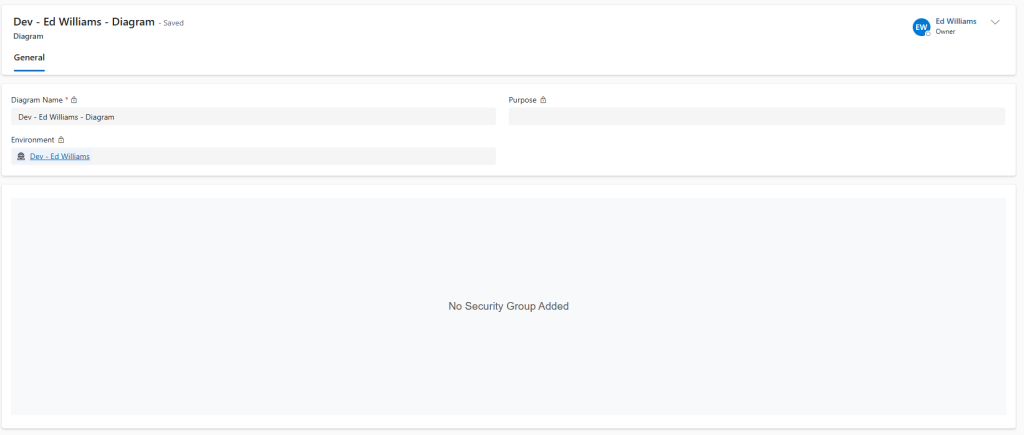
If the diagram is blank, it will be rendered as follows
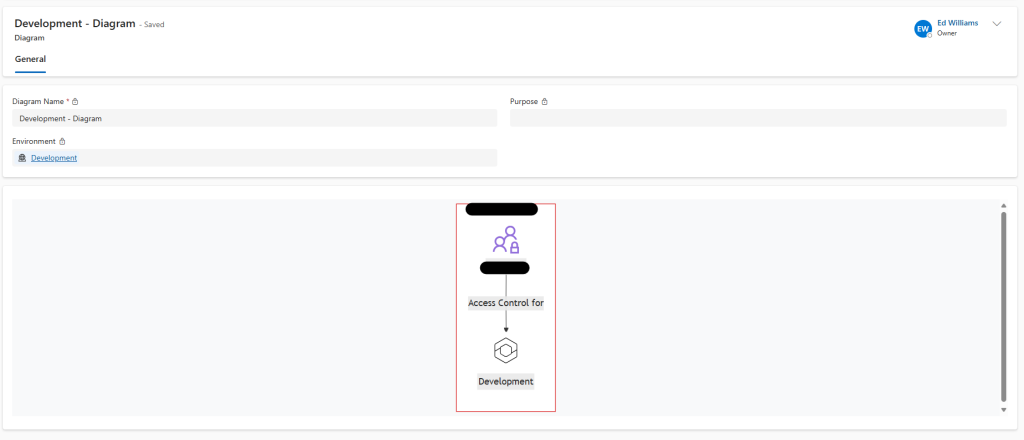
If there is a diagram it will be shown
The next part of this project will be to diagram the security of a solution and basic security roles (System Administrator)
