
The Why
I am a big fan of mermaid.js Mermaid | Diagramming and charting tool. I love how easy it is to build diagrams and charts using code. For a while I have been wanting to integrate into a Model Driven App, but haven't had a great use case. This week however I was asked to come up with a solution to speed up diagrams being built by our team and gave it a whirl. This post will go over the basics of building a mermaid diagram using power automate, saving it in Dataverse, then showing it in a model driven app.
The How
Table and app setup
I have a solution called Mermaid. In the solution I have a table called mermaid with a multiline rich text column called mermaidhtml.
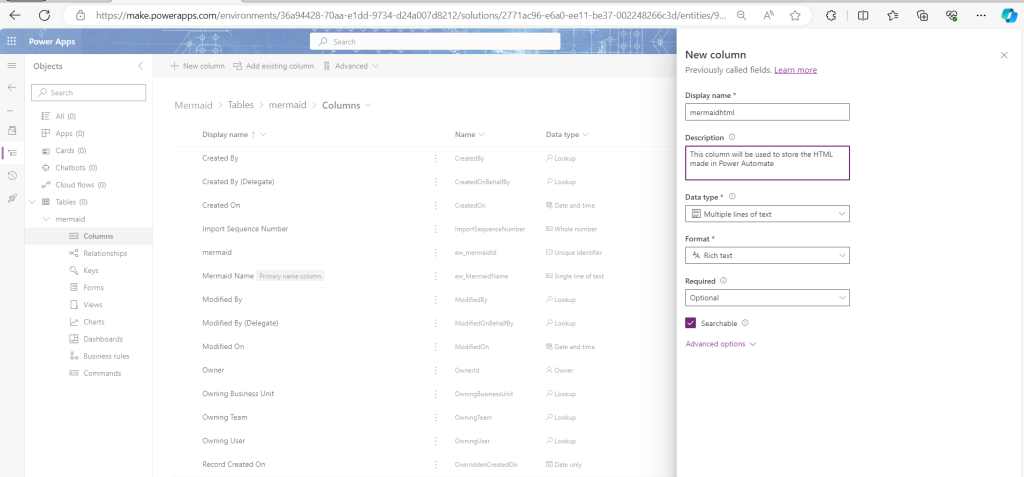
I have also created a MDA called Mermaid App with the mermaid table in it.
Mermaid Setup
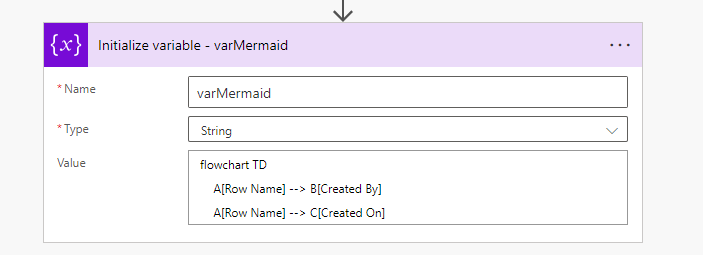
For this example I will be making a very simple diagram that shows the created by, the created on, and the Primary Name. You can get very complex with this and its really up to you as to what you want to make. Using the mermaid live editor I can plan out my design then copy and paste the code to Power Automate
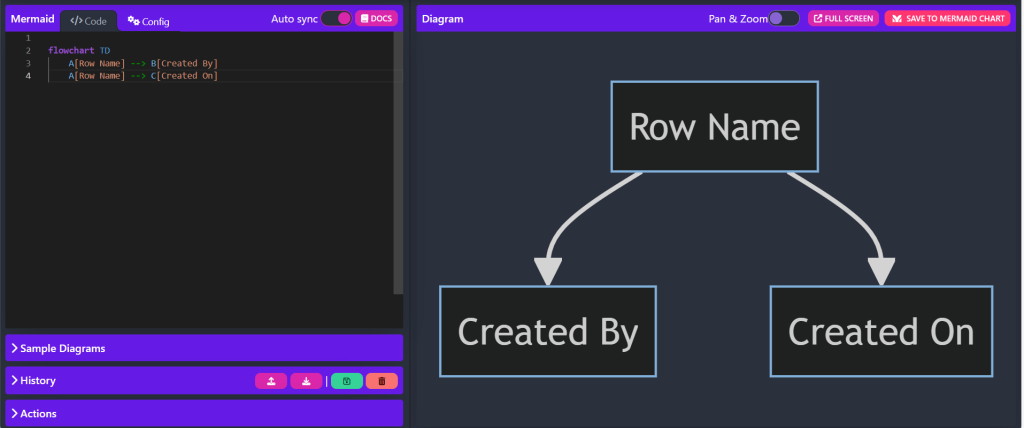
flowchart TD
    A[Row Name] --> B[Created By]
A[Row Name] --> C[Created On]Power Automate Flow
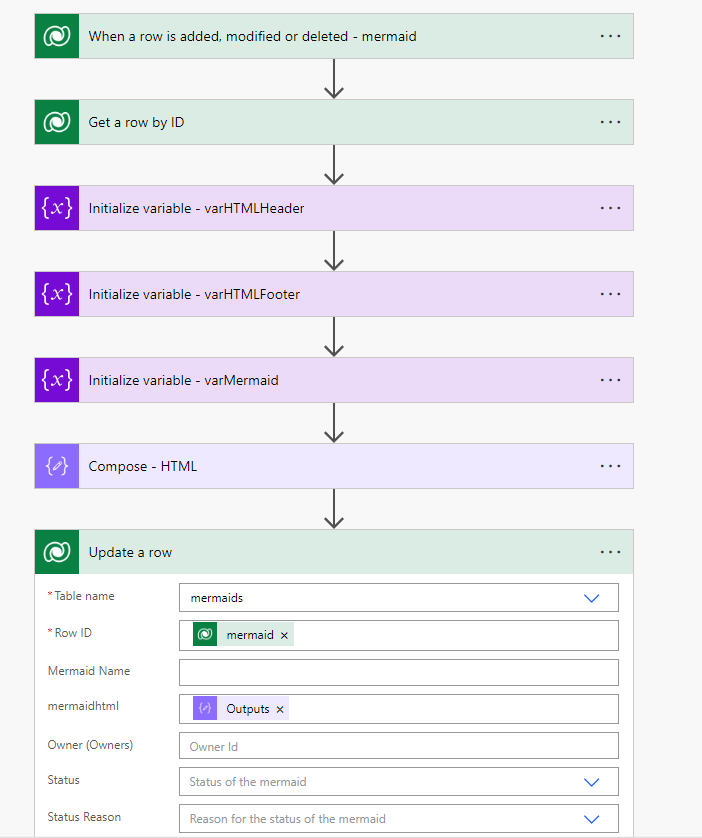
The trigger is when a new row is added to the mermaid table. Then get the row info. The second action is to define the HTML table
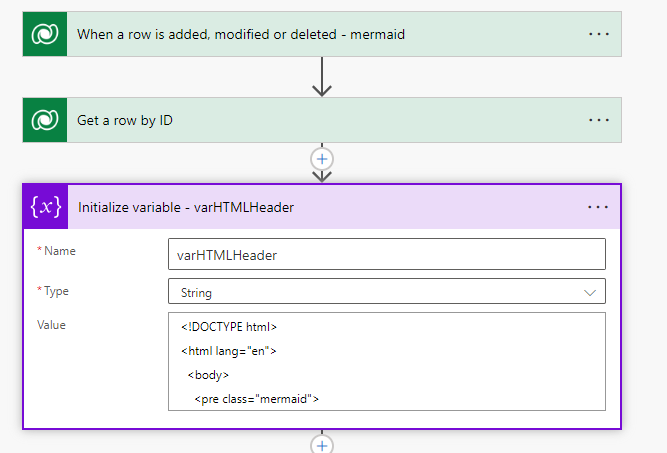
<!DOCTYPE html>
<html lang="en">
  <body>
    <pre class="mermaid">
The next action is to define the HTML footer
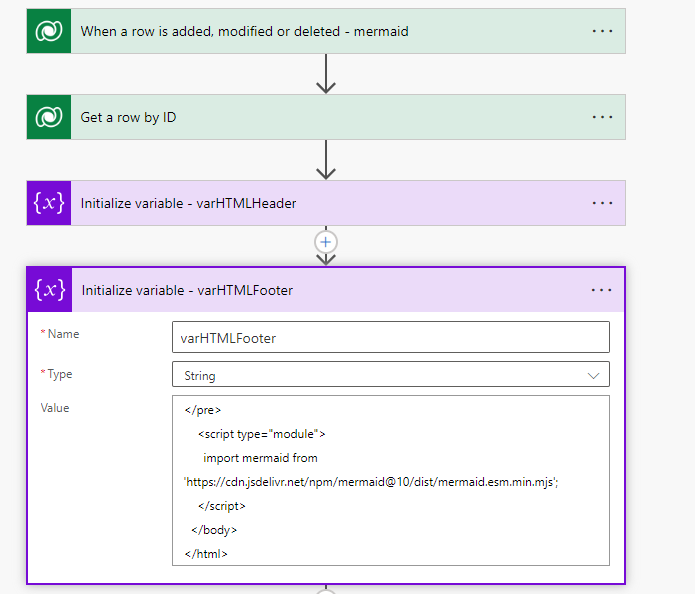
</pre>
    <script type="module">
      import mermaid from 'https://cdn.jsdelivr.net/npm/mermaid@10/dist/mermaid.esm.min.mjs';
    </script>
  </body>
</html>
The next action is to define and set the actual mermaid code
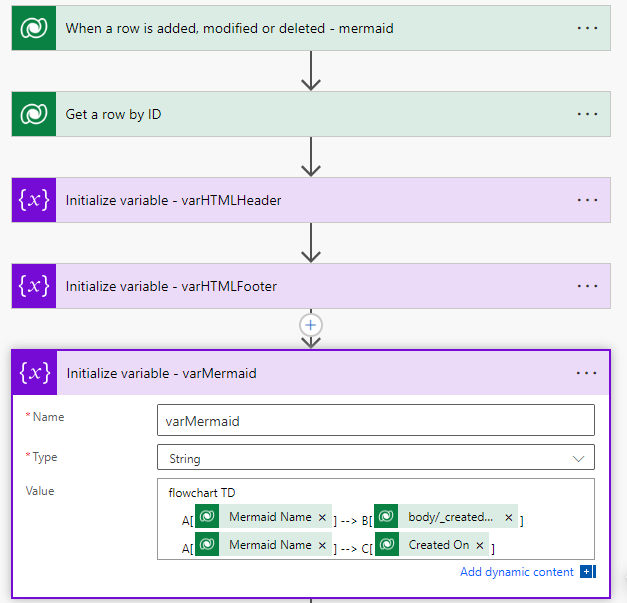
For the created by I am using the following code
@{outputs('Get_a_row_by_ID')?['body/_createdby_value@OData.Community.Display.V1.FormattedValue']}Next we need to combine all the code
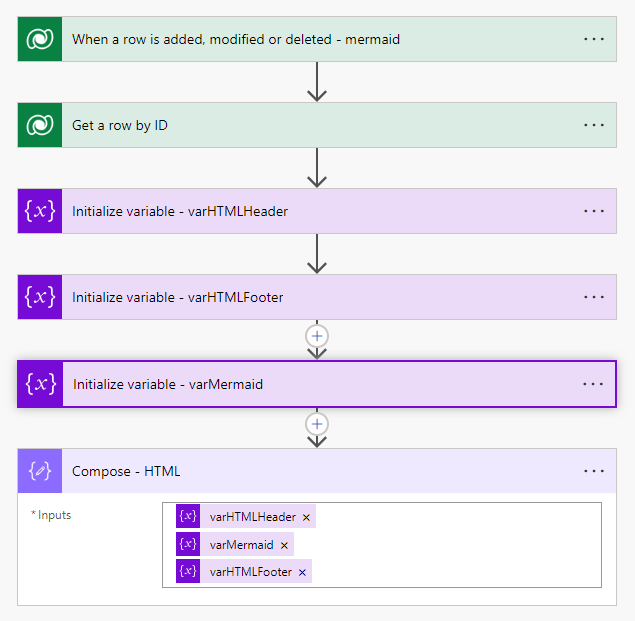
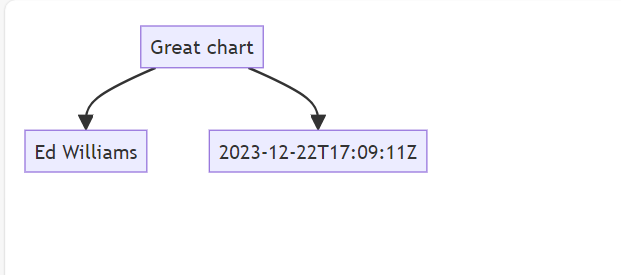
We can then create a row in our MDA and see the output of the compose
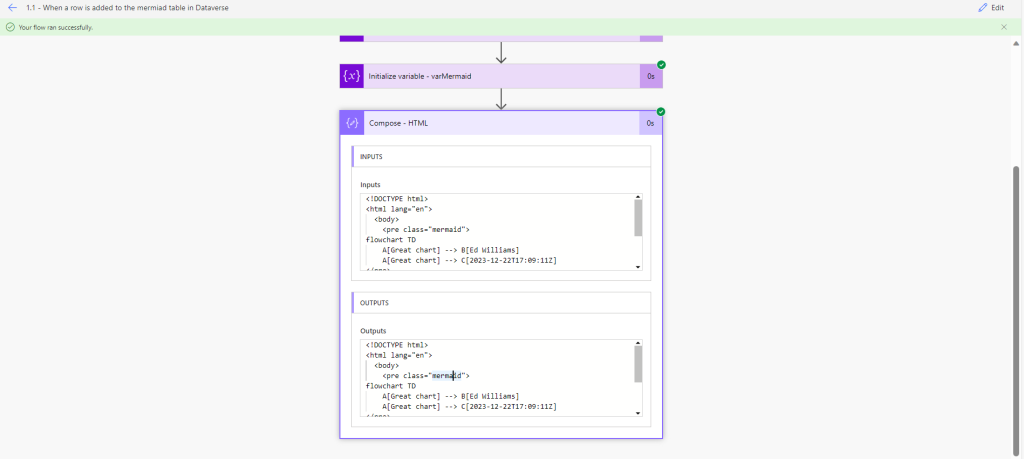
We can then save it to an HTML file and open it to verify that it looks the way we want.
With the diagram looking the way we want we can now write it to Dataverse
Web Resource Configuration
Next we need to create the HTML code that will display the the diagram
The code requires you to configure two things the entity set name and the column logical name
To get the entity set name use the following http call in your browser
https://YOURORG.crm.dynamics.com/api/data/v9.0/EntityDefinitions(LogicalName='YOURTABLE')?$select=EntitySetNameUpdate the code below with your information then save it as a .html file
<!DOCTYPE html>
<html>
<head>
<title>Diagram</title>
<style>
/* CSS to center the h1 heading */
body {
text-align: center;
}
</style>
<script src="https://cdn.jsdelivr.net/npm/mermaid@10/dist/mermaid.min.js"></script>
<script>
mermaid.initialize({ startOnLoad: false });
function fetchAndDisplayHtmlContent() {
var formContext = window.parent.Xrm.Page;
var recordId = formContext.data.entity.getId().replace('{', '').replace('}', '');
var entitySetName = "ew_mermaids"; // Update to your entity
var columnName = "ew_mermaidhtml"; // Update to use your column
var req = new XMLHttpRequest();
req.open("GET", formContext.context.getClientUrl() + "/api/data/v9.0/" + entitySetName + "(" + recordId + ")?$select=" + columnName, true);
req.setRequestHeader("OData-MaxVersion", "4.0");
req.setRequestHeader("OData-Version", "4.0");
req.setRequestHeader("Accept", "application/json");
req.setRequestHeader("Content-Type", "application/json; charset=utf-8");
req.onreadystatechange = function() {
if (this.readyState === 4) {
req.onreadystatechange = null;
if (this.status === 200) {
var result = JSON.parse(this.response);
var diagramHtml = result[columnName];
displayMermaidDiagram(diagramHtml);
} else {
// Handle error conditions
var error = JSON.parse(this.response).error;
console.error("Error fetching diagram HTML: ", error.message);
}
}
};
req.send();
}
function displayMermaidDiagram(diagramHtml) {
var mermaidCode = extractMermaidCode(diagramHtml);
var container = document.getElementById('diagramContainer');
container.textContent = mermaidCode; // Use textContent for plain text
mermaid.init(undefined, container);
}
function extractMermaidCode(html) {
var match = /<pre class=['"]mermaid['"]>([sS]*?)</pre>/.exec(html);
return match ? match[1].trim() : "Diagram code not found";
}
</script>
</head>
<body onload="fetchAndDisplayHtmlContent()">
<h1>Diagram</h1>
<div id="diagramContainer"></div>
</body>
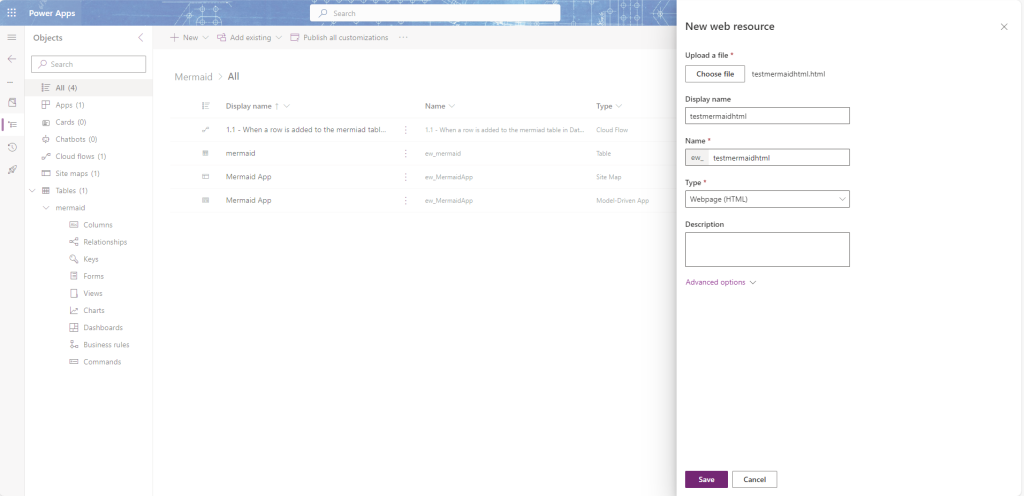
</html>Upload the html file to your solution as a webresource. For me I named it as testmermaidhtml
Form Configuration
The last step in our journey is to configure the form to show the diagram
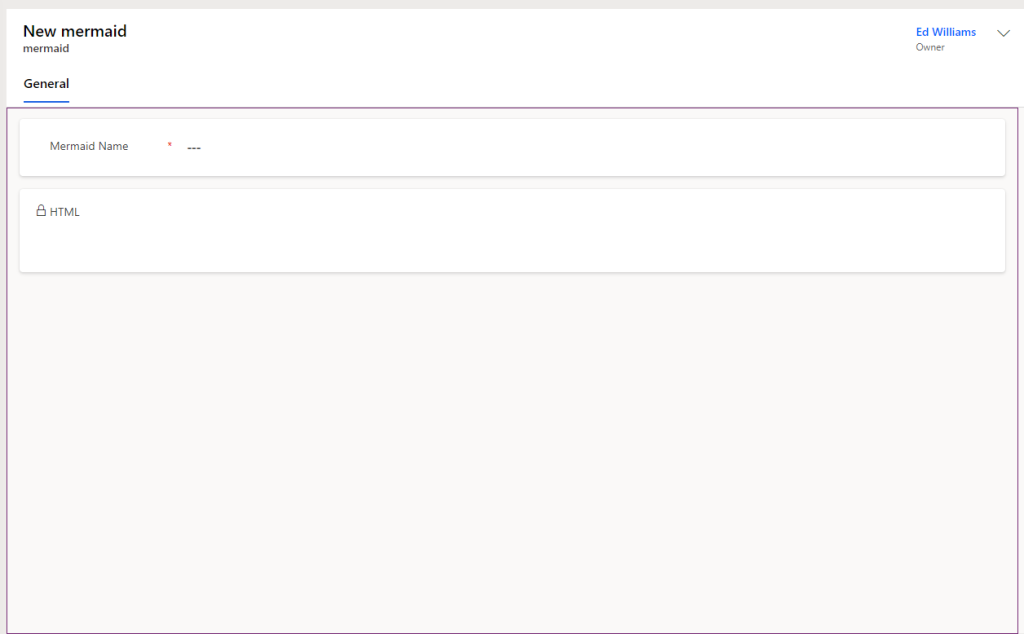
I updated a main form to have just the basic information I needed. Then I added a 2 column section and place the mermaidhtml column on the left hand side, then made it read only.
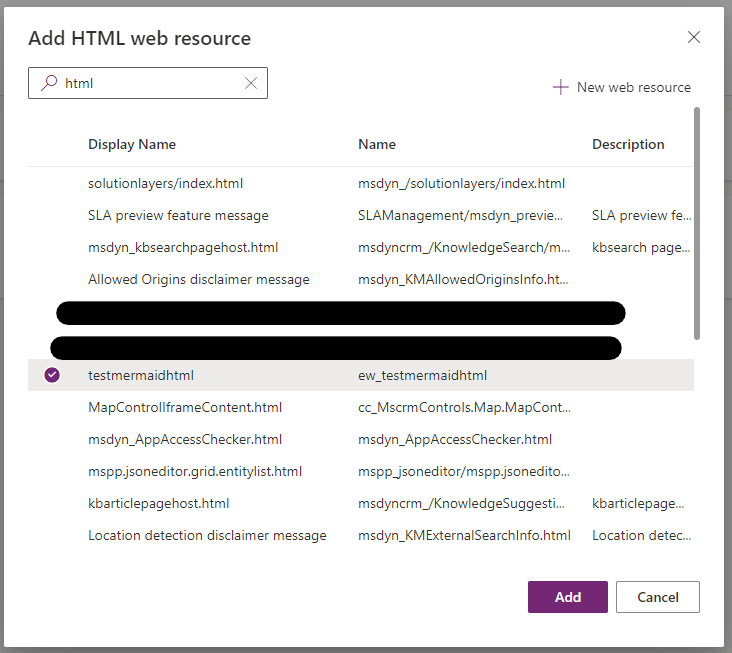
Then add a HTML web resource to the form and select the resource we created previously.
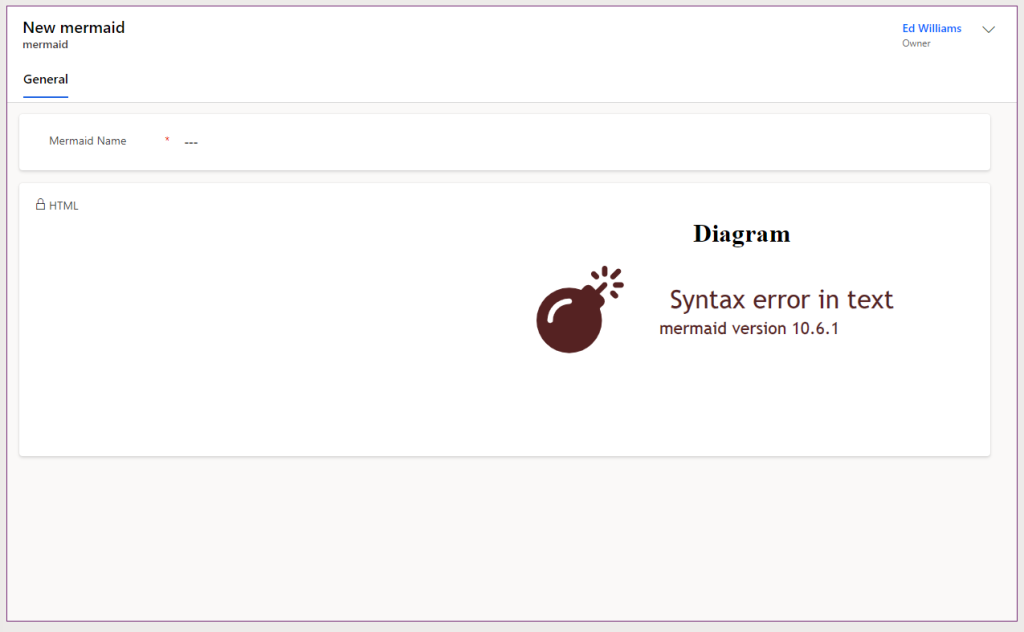
You should now see a “error” on the screen. This is because you are not actually in a row and are not pulling in any information.
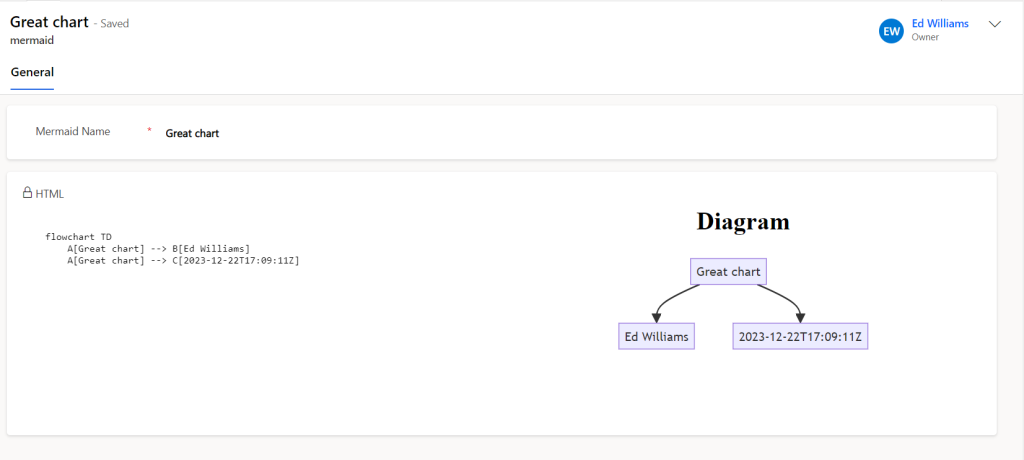
Save and publish the form. Then navigate to the MDA you made earlier. You should now see the diagram on the form!
Next Steps
This was a really fun project and I have a few ideas on how to improve it but for the time being go forth and have a great low code day.